When investigating PostgreSQL performance, the usual starting point is pg_stat_statements. From there, many teams sort queries by mean_exec_time or total_exec_time and start optimizing the first rows in the list.
That approach is simple, but it often leads to the wrong priorities.
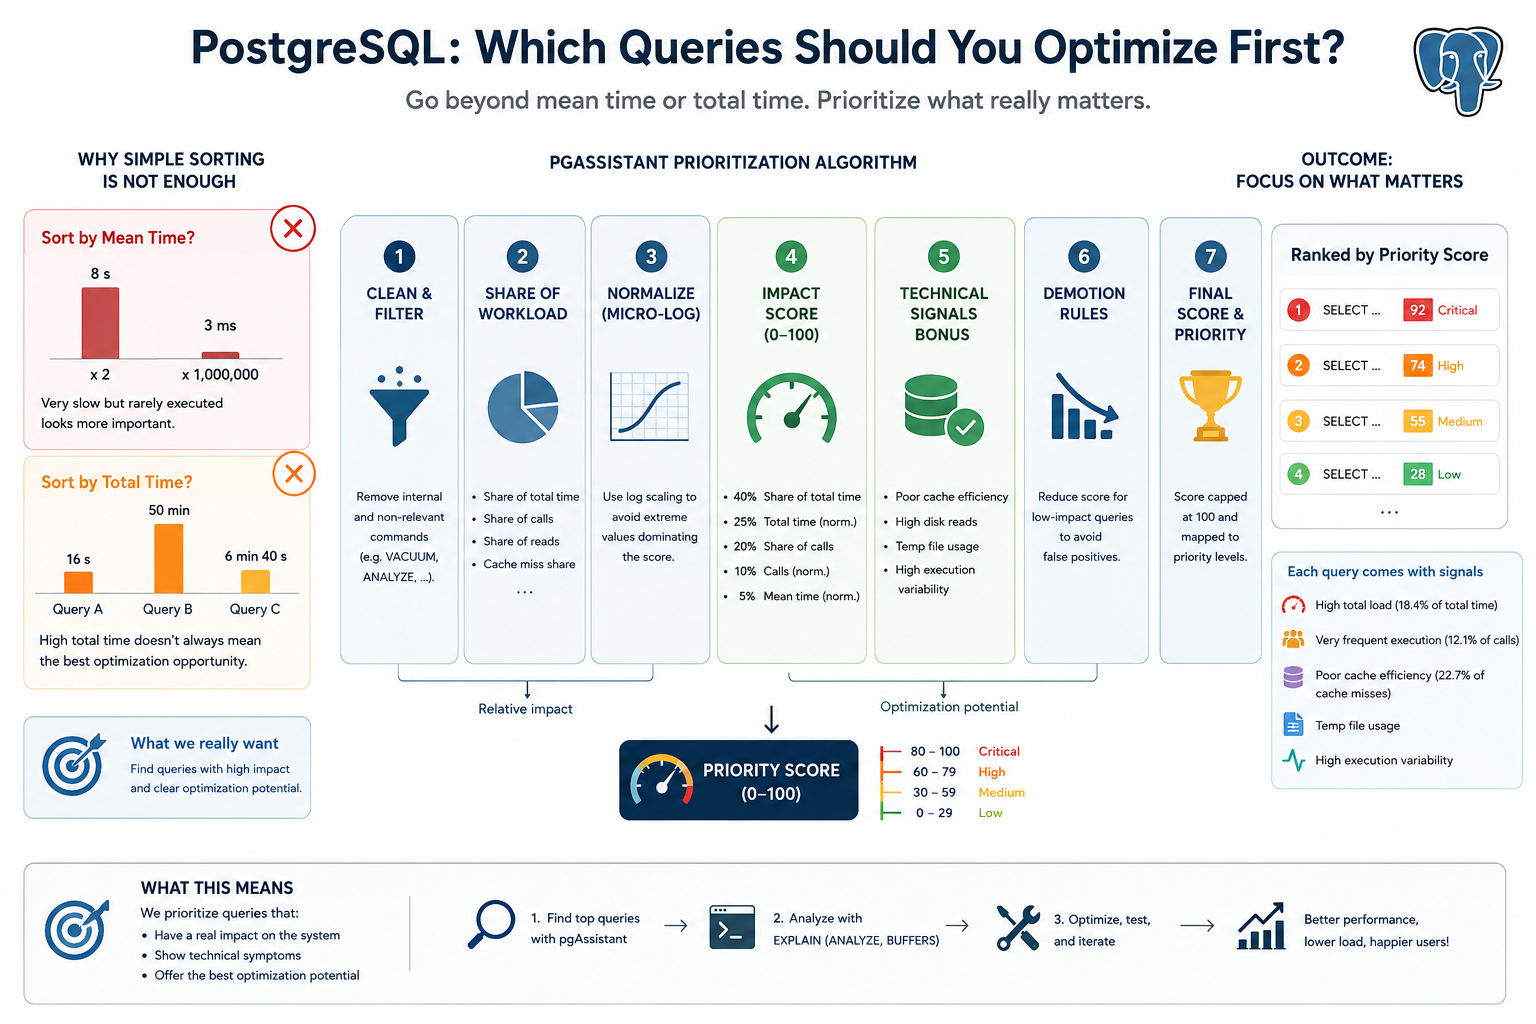
A query that takes five seconds but runs twice a day is not necessarily more important than a query that takes five milliseconds and runs millions of times. Conversely, a query with a high total execution time may simply be a normal core workload query, not necessarily the best optimization target.
The real question is not:
Which query is the slowest?
It is:
Which query has the highest operational impact and the clearest optimization potential?
This is the principle behind the query-ranking algorithm implemented in pgAssistant.
Why mean_exec_time is misleading
Sorting by average execution time highlights individually slow queries. This is useful for spotting obvious outliers, but it ignores execution frequency.
For example:
Query A: 5 seconds × 2 calls = 10 seconds total
Query B: 20 ms × 2,000,000 calls = 11+ hours total
A mean_exec_time ranking puts Query A first. In production, Query B is usually a much more valuable target.
Average latency answers the question: “Which query is slow when it runs?”
It does not answer: “Which query matters most to the system?”
Why total_exec_time is better, but still incomplete
total_exec_time is more useful because it accounts for frequency:
total_exec_time = mean_exec_time × calls
However, total time alone still misses important signals.
A query may consume a lot of total time because it is part of the normal application workload and already performs reasonably well. Another query may have a lower total time but show clear technical issues: poor cache efficiency, heavy disk reads, temporary file usage, or unstable execution times.
So total_exec_time tells us where time was spent, but not always where optimization effort should start.
The pgAssistant approach
pgAssistant ranks queries using a composite priority score. The score combines two categories of information:
- Workload impact: how much the query contributes to total database activity.
- Technical signals: symptoms that suggest the query may be inefficient or unstable.
Before scoring, pgAssistant normalizes query statistics and excludes queries that are not useful optimization targets, such as VACUUM, ANALYZE, EXPLAIN, DDL statements, and pgAssistant’s own internal queries.
Workload impact first
For each query, pgAssistant computes relative workload shares:
share_total = query total_exec_time / global total_exec_time
share_calls = query calls / global calls
share_io = query blocks read / global blocks read
cache_miss_share = query shared reads / global shared reads
This makes the ranking workload-aware. A query representing 20% of total execution time is not in the same category as a query representing 0.1%, even if their average execution times look similar.
The main impact score is weighted as follows:
impact_score =
    40 × normalized share of total time
  + 25 × normalized total execution time
  + 20 × normalized share of calls
  + 10 × normalized call count
  +  5 × normalized mean execution time
The key point is intentional: mean_exec_time contributes to the score, but it does not dominate it.
pgAssistant gives more weight to global impact and execution frequency than to isolated slowness.
Logarithmic normalization
PostgreSQL query statistics are often highly skewed. One query may run ten times, another ten million times. One query may consume milliseconds, another hours.
To avoid extreme values flattening the rest of the ranking, pgAssistant uses logarithmic normalization for metrics such as total time, calls, and mean time:
log10(value + 1) / log10(max_value + 1)
This preserves ordering while making the score more stable across very uneven workloads.
Technical signals
After workload impact, pgAssistant adds technical signals that often indicate optimization potential.
Poor cache efficiency
The algorithm computes a cache hit ratio from shared block hits and reads:
cache_hit_ratio = shared_blks_hit / (shared_blks_hit + shared_blks_read)
If the ratio is below 95%, the query has read at least 1,000 shared blocks, and it represents a meaningful share of cache misses, pgAssistant increases its priority.
Heavy disk reads
Queries responsible for a significant share of block reads receive an additional score. These are often candidates for better indexing, improved filtering, query rewriting, or plan analysis.
Temporary file usage
If a query writes temporary blocks, pgAssistant adds a fixed priority boost. Temporary files often point to expensive sorts, hash operations, aggregations, or insufficient memory for the execution plan.
High execution variance
A query whose standard deviation is much higher than its average execution time may be unstable. This can reveal parameter-sensitive behavior, cache dependency, poor estimates, or occasional bad plans.
Demotion rules
A composite score can still produce false positives. To avoid over-prioritizing queries with minimal real impact, pgAssistant applies demotion rules.
For example, queries with very low call share and negligible total time are capped to a low score. Queries representing less than 1% of both total time and calls are also capped.
This prevents technically interesting but operationally irrelevant queries from polluting the top of the ranking.
Priority levels and explanations
The final score is capped at 100 and mapped to a priority level:
80–100  Critical
60–79   High
30–59   Medium
0–29    Low
pgAssistant also attaches human-readable signals such as:
high_load
high_calls
slow
poor_cache
temp_usage
unstable
The goal is not only to rank queries, but also to explain why a query appears in the list.
For example:
High total load (18.4% of total time) + Very frequent execution (12.1% of calls)
or:
Poor cache efficiency (22.7% of cache misses) + Temp file usage
A ranking system should not be a black box. The score gives the order; the signals guide the investigation.
What this ranking finds
In practice, pgAssistant tends to surface four types of queries:
- Queries that consume a large share of total execution time.
- Queries that are executed very frequently.
- Queries that generate significant I/O pressure.
- Queries with unstable execution behavior.
These are often better optimization targets than the queries that are merely slow in isolation.
Conclusion
Optimizing PostgreSQL effectively is not about sorting queries by mean_exec_time and fixing the slowest one first.
It is also not enough to blindly sort by total_exec_time.
A good prioritization model should combine workload impact, execution frequency, I/O behavior, cache efficiency, temporary file usage, and execution stability.
That is what pgAssistant’s ranking algorithm does: it identifies the queries that matter most to the system and gives engineers a better starting point for deeper analysis with tools such as:
EXPLAIN (ANALYZE, BUFFERS)
The best query to optimize first is not always the slowest one. It is the one where optimization is most likely to reduce database load, latency, or instability.